Instagram DM Funnel Metrics for Personal Trainers: What to Track
The essential Instagram DM funnel metrics personal trainers should track from first message to qualified lead, booked call, show-up, and new client.
 Written by Dylan StottFounder of Kinetic AI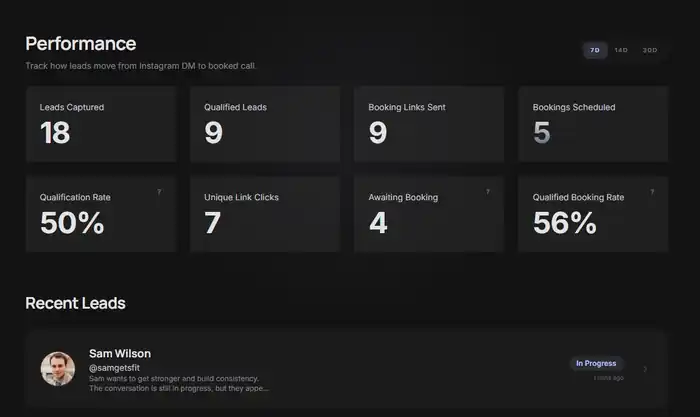
Most personal trainers do not have a lead problem they can clearly diagnose. They have a collection of Instagram conversations, booking notifications, and sales outcomes with no reliable view of where prospects are dropping out.
That is dangerous because weak performance at one stage can look like a completely different problem. A trainer may think they need more followers when the real issue is slow replies. They may blame lead quality when the real issue is that the booking link is being sent too early. They may book plenty of calls but lose revenue through no-shows.
The purpose of Instagram DM funnel metrics is not to create a complicated dashboard. It is to make the next business decision obvious. Track the few numbers that reveal how efficiently attention becomes conversations, qualified leads, booked calls, attended calls, and clients.
The Instagram DM funnel in one sentence
A practical Instagram DM funnel is: new inbound conversation, lead reply, qualification, booking link, booked call, attended call, and new client.
Every stage answers a different question. Are leads entering? Are they engaging? Are they a fit? Are they taking the next step? Are they showing up? Are they buying? Mixing those stages together produces vague conclusions and bad decisions.
- ✓Inbound DMs measure new conversation volume
- ✓Reply rate measures whether the opening message creates engagement
- ✓Qualification completion measures whether the conversation maintains momentum
- ✓Qualified-lead rate measures fit and intent
- ✓Booking rate measures how effectively qualified interest becomes a scheduled call
- ✓Show rate measures commitment after booking
- ✓Close rate measures sales performance on attended calls
Metric 1: New inbound conversations
Count the number of unique prospects who begin a relevant Instagram conversation during the reporting period. This is the top of the measurable DM funnel.
Do not count every message bubble. One person sending five messages is one conversation, not five leads. Also separate genuine prospects from customer support questions, existing clients, spam, and unrelated messages.
This metric tells you whether content, profile calls to action, story prompts, comment keywords, referrals, and other acquisition activities are creating enough opportunities for the rest of the funnel to work.
- ✓Track unique prospects, not total messages
- ✓Separate inbound leads from outbound conversations
- ✓Exclude existing-client support and obvious spam
- ✓Tag the source when possible, such as post, story, profile, referral, or advertisement
Metric 2: First-response time
First-response time is the time between a prospect's initial DM and the trainer's first meaningful reply. It should be measured with a median as well as an average because a few extremely late replies can distort the average.
Speed matters because interest is highest when the person chooses to reach out. A fast reply does not guarantee a sale, but a slow reply gives the prospect more time to get distracted, contact another coach, or lose urgency.
The goal is not to send a robotic answer in seconds and call the problem solved. The response must move the conversation forward with a relevant, easy-to-answer question.
- ✓Median first-response time
- ✓Percentage answered within 5 minutes
- ✓Percentage answered within 1 hour
- ✓Percentage that waited more than 24 hours
Related reading
Metric 3: Lead reply rate
Lead reply rate shows how many new prospects respond after the trainer or automation sends the first meaningful message.
Use this formula: lead reply rate equals prospects who replied divided by new inbound conversations, multiplied by 100.
For example, if 100 prospects start conversations and 68 answer the first question, the lead reply rate is 68 percent. That is an example, not an industry benchmark.
A low reply rate usually points to the opening message, response delay, message relevance, or a mismatch between the content call to action and what happens in the DM. It does not automatically mean the leads are bad.
Metric 4: Qualification completion rate
Qualification completion rate measures the percentage of responding leads who provide enough information for the business to decide whether a sales call makes sense.
Use this formula: qualification completion rate equals leads who completed qualification divided by leads who replied, multiplied by 100.
A lead does not need to answer a 20-question intake form. The system only needs enough context to understand the person's goal, obstacle, current situation, timeline, and practical fit for the offer.
If completion is weak, the qualification flow may be too long, too formal, repetitive, or poorly sequenced. Asking one clear question at a time is generally easier than dropping a questionnaire into the conversation.
Metric 5: Qualified-lead rate
Qualified-lead rate shows what percentage of completed conversations contain a prospect who matches the trainer's actual criteria for a call.
Use this formula: qualified-lead rate equals qualified leads divided by leads who completed qualification, multiplied by 100.
Qualification criteria should be defined before looking at the data. Otherwise, the standard quietly changes every week and the metric becomes meaningless.
- ✓The prospect has a goal the program can reasonably address
- ✓The prospect recognizes a real problem or gap
- ✓The offer fits the prospect's situation and needs
- ✓The prospect has an appropriate timeline or level of intent
- ✓A sales call is a sensible next step rather than free advice or support
Metric 6: Booking-link delivery rate
Booking-link delivery rate measures how many qualified leads are actually invited to book. This catches an operational failure that is easy to miss: good prospects finishing qualification but never receiving a clear next step.
Use this formula: booking-link delivery rate equals qualified leads sent a booking link divided by total qualified leads, multiplied by 100.
A low rate may mean conversations are being forgotten, handoffs are unclear, team members are inconsistent, or the trainer hesitates to transition into the call invitation.
A high rate is not automatically good if the qualification standard is weak. Sending links to everyone can inflate call volume while reducing show rate and calendar quality.
Metric 7: Qualified-lead booking rate
Qualified-lead booking rate is one of the most useful conversion metrics in the system. It measures the percentage of qualified prospects who schedule after receiving the next step.
Use this formula: qualified-lead booking rate equals calls booked divided by qualified leads sent a booking link, multiplied by 100.
If this number is low, inspect the transition before blaming the calendar. The booking message may feel generic, the call may not have a clear purpose, the available times may be inconvenient, or too much time may pass between qualification and the invitation.
Related reading
Metric 8: Show rate
Show rate measures the percentage of scheduled prospects who attend the call. Use this formula: show rate equals attended calls divided by booked calls, multiplied by 100.
Track rescheduled calls separately from true no-shows. Someone who moves the meeting and attends later should not be treated the same as someone who disappears.
A weak show rate can indicate poor qualification, weak call framing, excessive delay between booking and appointment, missing reminders, or low commitment during the DM conversation.
Metric 9: Close rate on attended calls
Close rate should be calculated from attended, qualified sales calls, not from every calendar booking. Use this formula: close rate equals new clients divided by attended qualified calls, multiplied by 100.
This distinction protects the diagnosis. A trainer with a strong close rate and weak show rate has a different problem from a trainer with excellent attendance and a weak close rate.
Also record outcomes such as follow-up required, not ready, unqualified after deeper discovery, and lost. A single yes-or-no column hides useful information about the sales process.
Metric 10: Revenue per inbound conversation
Revenue per inbound conversation connects the entire funnel to business value. Use this formula: collected revenue attributed to the cohort divided by new inbound conversations in that cohort.
For example, if 100 inbound conversations eventually produce four clients who each pay $1,500, attributed revenue is $6,000 and revenue per inbound conversation is $60.
Use collected revenue when possible rather than theoretical contract value. If clients pay monthly, define whether the metric uses first payment, cash collected within 30 days, or a consistent longer attribution window.
A worked Instagram DM funnel example
Assume a trainer records 100 new inbound conversations during one month. Sixty-eight prospects reply, 48 complete qualification, 30 are qualified, 27 receive a booking link, 15 book, 12 attend, and four become clients.
The funnel can now be evaluated stage by stage instead of judged by emotion.
- ✓Lead reply rate: 68 divided by 100 = 68%
- ✓Qualification completion rate: 48 divided by 68 = 70.6%
- ✓Qualified-lead rate: 30 divided by 48 = 62.5%
- ✓Booking-link delivery rate: 27 divided by 30 = 90%
- ✓Qualified-lead booking rate: 15 divided by 27 = 55.6%
- ✓Show rate: 12 divided by 15 = 80%
- ✓Close rate: 4 divided by 12 = 33.3%
- ✓Overall inbound-to-client rate: 4 divided by 100 = 4%
How to identify the real bottleneck
Do not optimize the metric that feels most interesting. Optimize the stage that is creating the largest practical loss.
If inbound volume is low but downstream conversion is strong, improve content distribution and calls to action. If conversations are plentiful but reply rate is weak, fix speed and the opening message. If qualified leads rarely book, improve the transition and booking experience. If booked prospects do not attend, strengthen qualification and reminders. If qualified calls attend but do not buy, work on the offer and sales process.
The bottleneck can change after each improvement. That is why the funnel should be reviewed repeatedly rather than diagnosed once and forgotten.
Track cohorts instead of mixing every lead together
A lead who starts a conversation on the final day of the month has not had the same opportunity to book and buy as a lead who entered on the first day. Mixing both together can make recent performance look worse than it is.
A better approach is cohort tracking. Group prospects by the week or month they entered, then allow a consistent conversion window before judging final outcomes.
Also segment by source when volume is sufficient. Story leads, post-keyword leads, referrals, advertisements, and profile visitors may behave differently. Source-level data helps the trainer invest in the channels producing qualified clients rather than empty engagement.
The minimum dashboard a trainer actually needs
A useful weekly dashboard can fit on one screen. Complexity is not sophistication if nobody uses the report.
- ✓New inbound conversations
- ✓Median first-response time
- ✓Lead reply rate
- ✓Completed qualifications
- ✓Qualified leads
- ✓Booking links sent
- ✓Calls booked
- ✓Calls attended
- ✓New clients
- ✓Collected revenue
Common measurement mistakes
The fastest way to make a dashboard useless is to change definitions, mix incompatible data, or treat every correlation as proof of causation.
- ✓Counting messages instead of unique prospects
- ✓Treating every DM as a sales lead
- ✓Calculating close rate from booked calls instead of attended qualified calls
- ✓Mixing inbound and outbound lead sources
- ✓Changing qualification criteria after seeing the results
- ✓Using revenue promised instead of a consistent collected-revenue definition
- ✓Comparing tiny samples and declaring a winner
- ✓Optimizing one metric while damaging the next stage
Final takeaway
The best Instagram DM funnel metrics do more than report activity. They expose the exact stage limiting growth.
Start with unique inbound conversations, response speed, reply rate, qualification completion, qualified-lead rate, booking rate, show rate, close rate, and revenue. Define each metric once, track it consistently, and fix the largest bottleneck before adding more traffic.
Kinetic AI is designed around this workflow: respond to inbound Instagram leads, qualify them, send the booking link when the next step makes sense, and give trainers visibility into what happens after the first DM.
Kinetic Growth Partnership
Build a more predictable online fitness coaching business
The Growth Partnership helps online fitness coaches identify the constraint limiting growth, build the missing strategy and systems around it, and review the numbers so the next priority stays clear.